2013-2014 Annual Report fmi igf
Victoria
75
Vancouver
67
Edmonton
80
Regina
39
Manitoba
160
Ontario
200
Capital
298
Montreal
34
Quebec
279
Fredericton
135
SE New Brunswick
66
Halifax
73
Prince Edward Island
105
St. John’s
257
Total
1,868
*Tables include estimates for the Ontario chapter.
fmi igf 2013-2014 Chapters and Membership
Chapter Membership
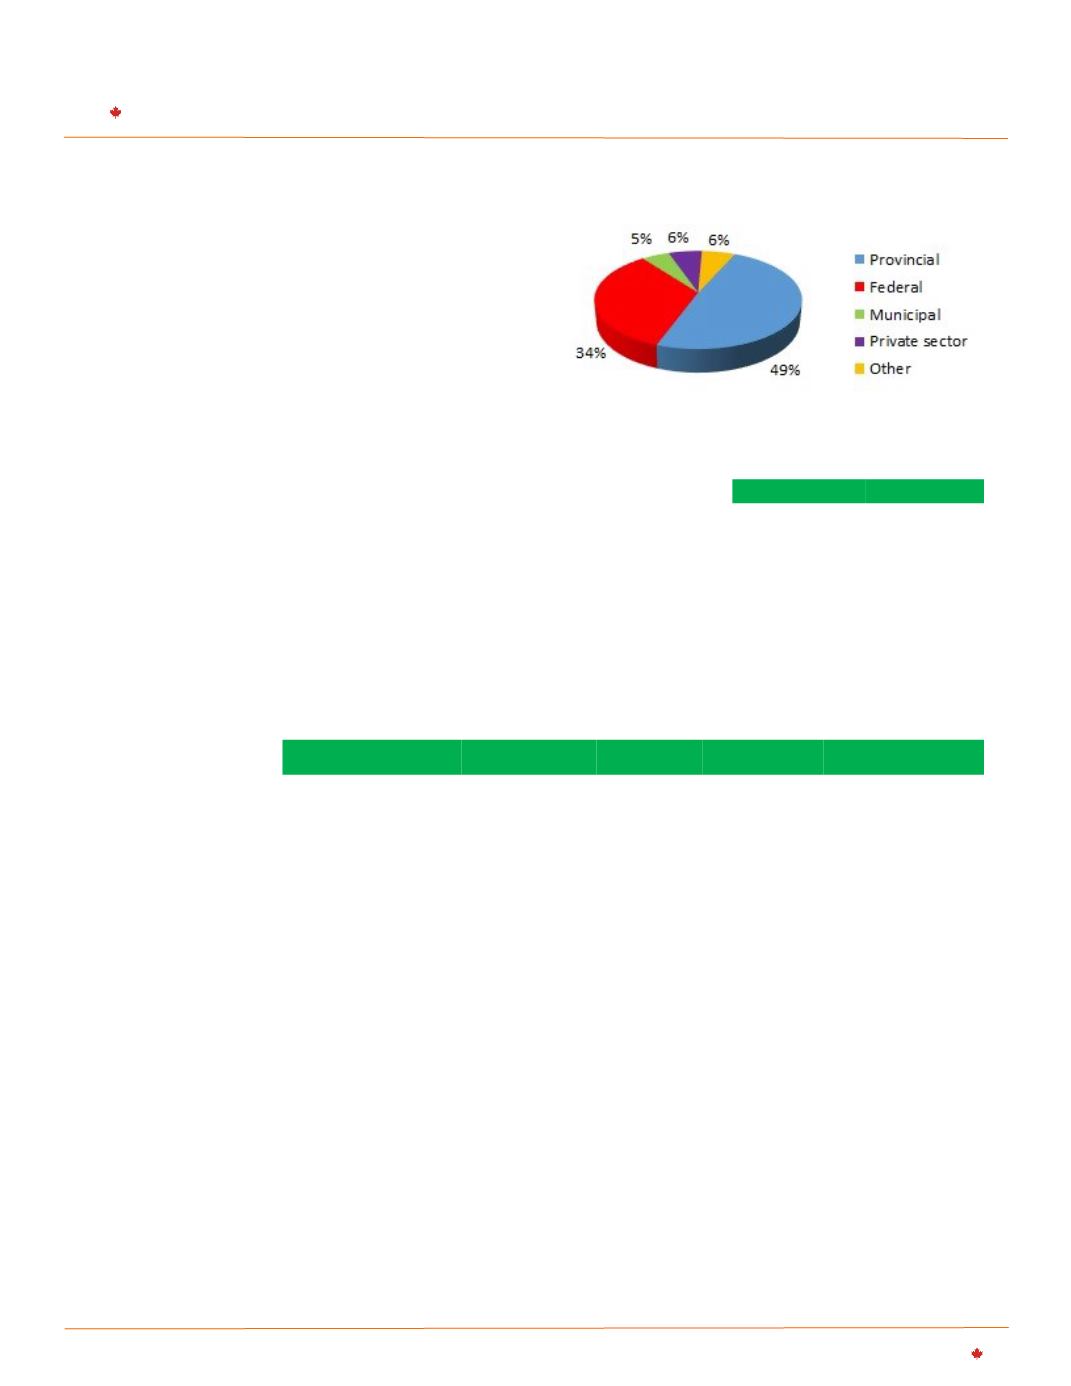
National Membership Distribution
Key Events Comparative Statistics
Chapter
Events
PD Credits Participants
Total PD Credits
St. John's
8
16
729
1,458
Halifax
6
18
156
468
PEI
5
26
157
735
Fredericton
7
7
253
253
SENB
4
13
113
370
Quebec
6
9
1,714
2,581
Montreal
6
6
201
201
Capital
6
39
641
4,166
Ontario
4
16
400
4,000
Manitoba
5
5
347
347
Edmonton
4
12
345
1,035
Regina
2
2
60
120
Vancouver
4
13
185
615
Victoria
8
22
400
2,917
PSMW
2
14
277
1,939
PD Week
4
21
4,004
21,253
Webinars
7
7
1,391
1,391
TOTAL
74
246
11,373
43,849
2013-2014
2012-2013
Number of events
74
86
Attendance
11,373
11,725
PD Hours
246
255
PD Credits
43,849
61,633
Summary of Professional Development Events


